Capacity Planning Template for Software Agencies (2026)
Compute your team's real billable capacity with one number, then use three thresholds to decide when to hire, raise rates, or say no. Copy-paste template inside.
Updated on July 9, 2026

On this page
Quick Answer. A capacity planning template converts your team's available billable hours into a single committable number. Multiply headcount by scheduled hours by a target utilization rate, then subtract the hours already booked, and you have the real capacity you can sell for the next quarter. Below is a copy-paste template, a worked example for a five-person agency, and the three thresholds that tell you when to hire, when to raise rates, and when to decline the next project. Updated July 2026.
Most agencies do not run out of capacity all at once. They run out of it quietly, one over-promised deadline at a time, because capacity lived in someone's head instead of in a number. The symptom shows up as either a bench nobody is billing or a delivery team quietly working weekends to cover work that was sold on optimism. Both are planning failures, and both are avoidable with one spreadsheet you update every week.
What capacity actually is
Capacity is not headcount, and it is not the sum of everyone's contracted hours. It is the number of hours your team can realistically bill against client work after you subtract the meetings, the internal projects, the sales calls, the sick days, and the context-switching that no delivery week escapes. That gap between contracted hours and truly billable hours is captured in one figure: target utilization.
The equation is deliberately simple:
Available billable hours = headcount x scheduled hours x target utilization
The only input that requires judgment is utilization. A senior delivery engineer might realistically sustain 70 to 75 percent. A designer splitting time across pitches and delivery lands closer to 60 to 65 percent. A founder still selling and running the business is often 30 to 40 percent billable at best. Plan with those real numbers, not with the fantasy that everyone bills 40 hours out of 40.
A worked example: the five-person agency
Here is the calculation for a small delivery team. Every number is a weekly figure.
Scroll to see more
| Role | Scheduled hrs/wk | Target utilization | Billable hrs/wk |
|---|---|---|---|
| Senior engineer | 40 | 75% | 30 |
| Engineer | 40 | 75% | 30 |
| Engineer | 40 | 70% | 28 |
| Designer | 40 | 65% | 26 |
| Founder / lead | 40 | 35% | 14 |
| Team total | 128 |
This agency has roughly 128 billable hours per week, or about 1,660 hours per quarter across a 13-week planning window. That single number is the ceiling. Every proposal, every change request, and every "quick favor" for an existing client draws against it. When you know the ceiling, you can size your pipeline to it instead of discovering it by burning out your team.
Utilization is also the hinge between capacity and money. The same hours planned here are the hours you divide your costs across to get your effective hourly rate, and the utilization you assume directly changes what a healthy blended rate has to be. Plan capacity and price from the same utilization figure, or the two documents will quietly contradict each other.
The template (copy-paste)
Paste this into a sheet or a Markdown doc and fill the top block. The formulas are written in plain arithmetic so they port to any tool.
# Capacity Plan, Q_ 2026

## 1. Team capacity (weekly)
| Person | Role | Scheduled hrs | Target util % | Billable hrs |
|--------|------|---------------|---------------|--------------|
|        |      | 40            | 70%           | =sched*util  |
|        |      | 40            | 70%           | =sched*util  |
| TOTAL  |      |               |               | =SUM         |

Weekly billable capacity = SUM(Billable hrs)
Quarterly capacity      = Weekly capacity x 13

## 2. Committed hours (this quarter)
| Client / project | Hrs committed | End date |
|------------------|---------------|----------|
|                  |               |          |
Total committed   = SUM(Hrs committed)

## 3. Remaining capacity
Remaining hours   = Quarterly capacity - Total committed
Remaining %       = Remaining hours / Quarterly capacity

## 4. Signals
Team utilization  = Committed (this week) / Weekly capacity
Bench %           = 1 - Team utilization
The value of the template is not the arithmetic. It is that it forces you to write down committed hours before you sign the next contract, which is exactly the moment most agencies skip.
Reading the number: three thresholds
A capacity plan is only useful if it changes a decision. Three thresholds do most of the work:
- Utilization runs above target for three-plus weeks straight. You are not efficient, you are overbooked. This is the earliest and cleanest signal to raise rates on new work or add a hire, before quality slips and before your team decides the fix is to leave.
- Remaining quarterly capacity drops below 15 percent. Stop selling net-new delivery and protect the commitments you already have. Discounting to squeeze in one more project at this point trades a small revenue bump for a large delivery risk.
- Bench sits above 25 percent for two-plus weeks. You have real idle capacity. Sell it or reallocate people to productized work, but resist the reflex to discount hard just to fill it. A cut rate is much easier to give than to take back, and it resets the client's anchor for every future project.
Where AI-assisted delivery changes the math
Faster build tooling has genuinely moved this equation in 2026. When a team ships a working feature in hours that used to take days, the hours-per-deliverable falls, which raises effective capacity without adding headcount. That is real, and it is worth planning around.
The honest caveat is that the saved hours do not disappear evenly. AI-assisted builds shift the mix toward specification, review, and QA time, so your utilization assumptions should be re-measured, not assumed to hold. Track actual billable hours against plan with a resource tool such as Float, and lean on the utilization and profitability framing that Parakeeto has documented for agency operators. Recompute your utilization targets once a quarter from real timesheet data rather than trusting last year's percentages. The agencies that treat the AI-driven speedup as a reason to sell more carefully, not just more, are the ones keeping the margin. For the packaging side of that decision, our rate-card benchmarks by agency archetype show where the freed capacity is best repriced.
Action checklist
- Build the team-capacity table with real, role-specific utilization targets, not 100 percent.
- Multiply by 13 to get quarterly capacity, and treat that as a hard ceiling.
- Log every committed project's hours before it starts, not after.
- Recompute remaining capacity and bench weekly, on the same day, every week.
- Wire the three thresholds to a decision: hire, hold, or reallocate.
- Re-measure utilization from timesheets each quarter, especially if AI tooling changed your delivery speed.
If you take one thing from this: Capacity is a number you recompute every week, not a feeling you have on Friday. The agencies that stay profitable size the pipeline to the number, not the number to the pipeline.

Written by
Ravi IyerRavi Iyer writes on agency operations, pricing, and delivery discipline for DevShopVault. He focuses on the packaging and handoff decisions that keep fixed-price AI engagements profitable.
Frequently asked questions
What is a capacity planning template for an agency?
A capacity planning template is a simple sheet that converts your team's available billable hours into one committable number. You list each person's scheduled hours and a realistic target utilization rate, multiply to get weekly billable hours, extend it across the quarter, then subtract already-committed work to see how much delivery capacity you can still sell.
How do you calculate a software agency's billable capacity?
Multiply headcount by scheduled weekly hours by a target utilization rate for each role, then sum the result. A five-person team at realistic utilization (roughly 65 to 75 percent for delivery roles and 30 to 40 percent for a still-selling founder) lands near 128 billable hours per week, or about 1,660 hours per quarter across 13 weeks.
What is a good target utilization rate for a software agency in 2026?
For delivery engineers, a sustainable target is about 70 to 75 percent. Designers who split time across pitches and delivery land closer to 60 to 65 percent, and a founder still selling is often 30 to 40 percent billable. Plan with role-specific numbers pulled from real timesheets rather than assuming everyone bills a full 40-hour week.
When should an agency hire based on capacity planning?
The cleanest signal is utilization running above your target for three or more weeks in a row while remaining quarterly capacity keeps falling. That means you are overbooked, not efficient, and it is the moment to raise rates on new work or add a hire before delivery quality slips.
Related entries

Change Orders on Fixed-Price AI App Builds: A 2026 Decision Matrix for Agencies
AI app builders collapsed the cost of UI re-work but not structural work. Here is the two-band decision matrix agencies should use to decide when to absorb a change, charge a small fee, or write a real change order.
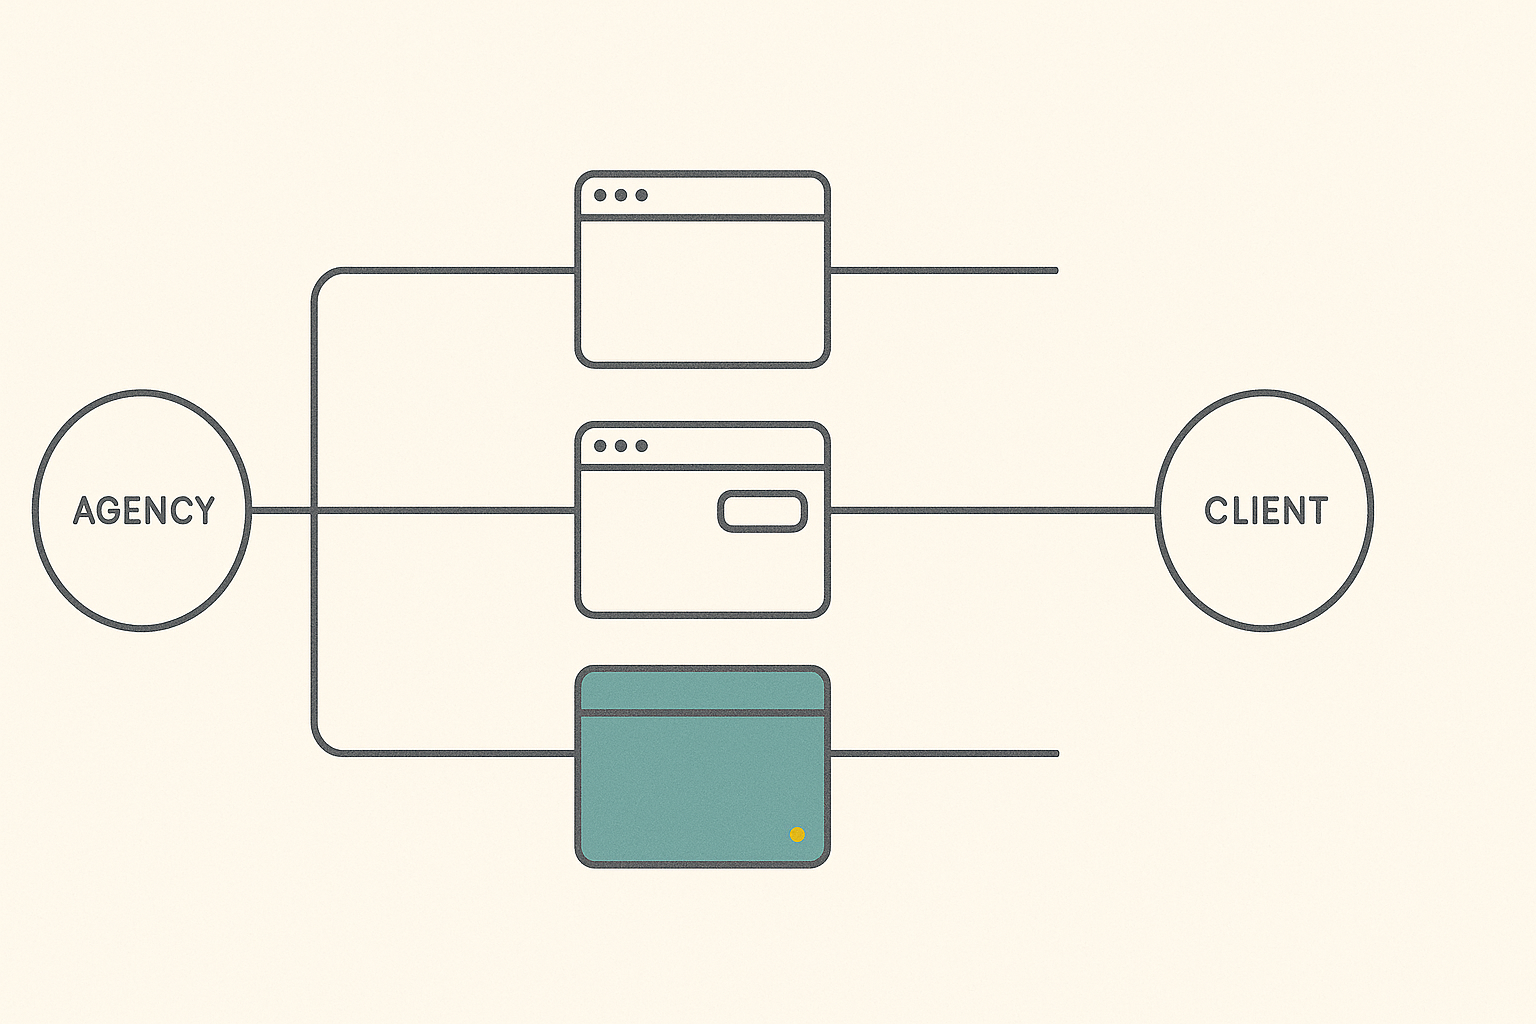
White-Label vs Reseller vs Referral for Agencies (2026)
A decision framework for agencies choosing between white-label, reseller, and referral partnership models on the platforms behind their AI builds, with a six-axis matrix and worked margin math.
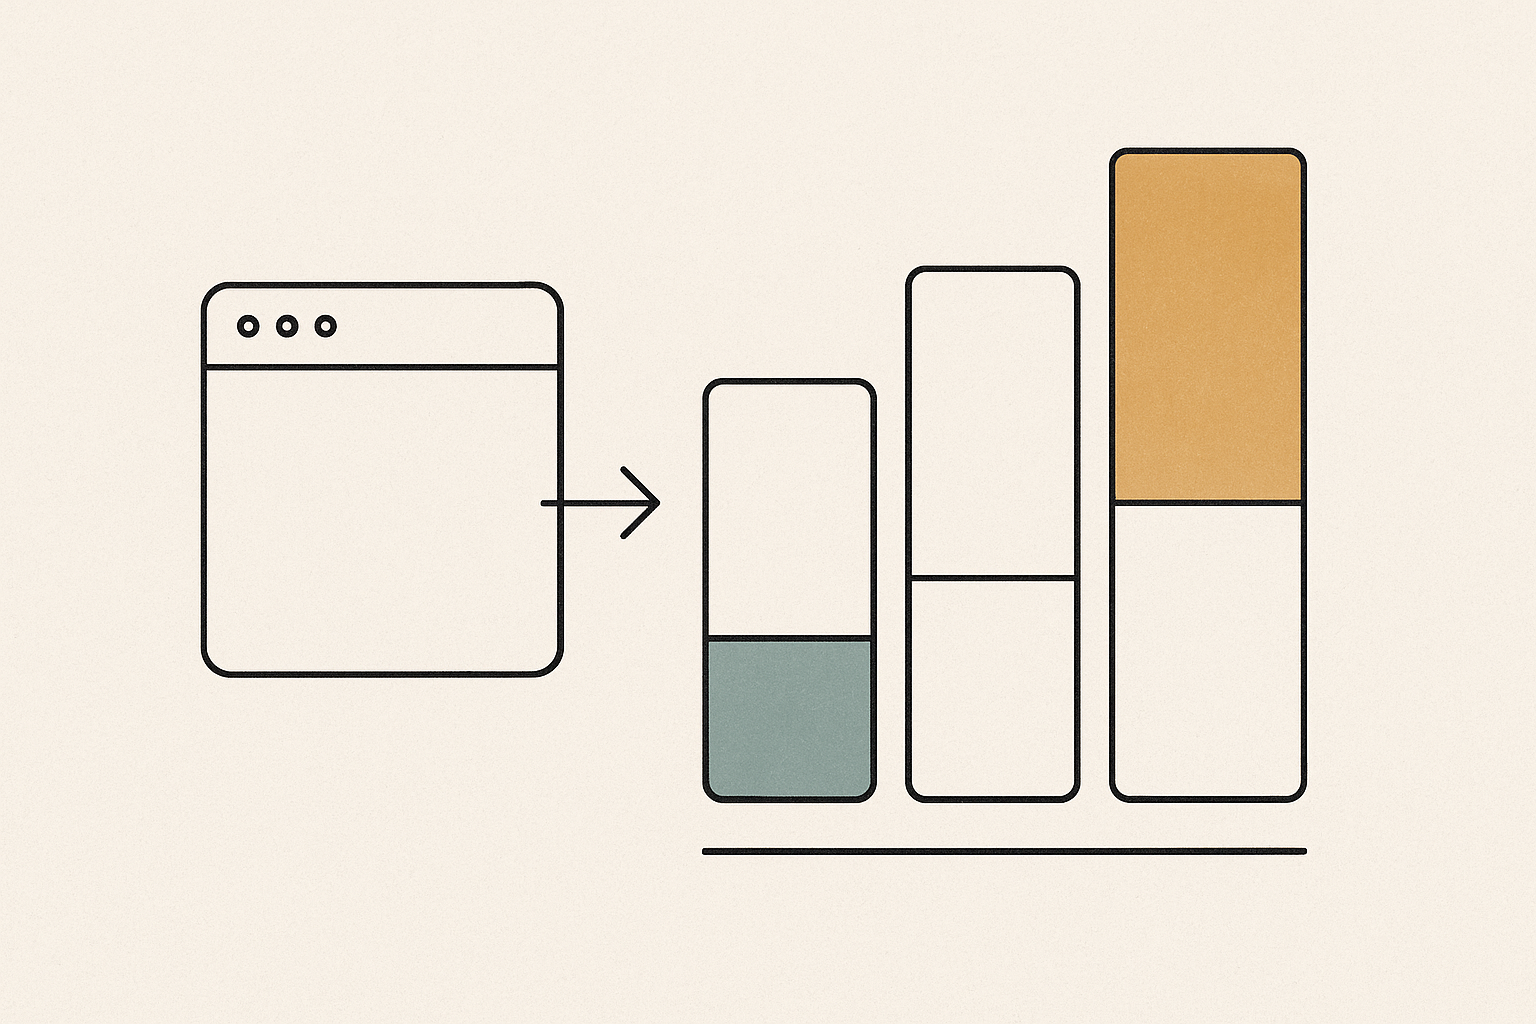
White-Label AI App Builder Pricing for Agencies (2026)
White-label AI app builder pricing splits into two layers agencies keep conflating: the platform fee and the client sell price. Here is the real 2026 cost picture, the per-project trap, and a worked margin model.